| |
|
ChinaSite.com:
Site Analysis
|
|
The
Complete Reference to
China/Chinese-Related Web Sites |
 |
|
|
|
|
|
Please see the most
recent Site Analysis.
|
|
Table of Contents
|
Highlights:
|
- Site Summary of ChinaSite.com
- General Activity Statistics
- User Organization and Geography
- Request Summary
- Visit Summary
- Daily Hits Trend and Statistics
- Bandwidth Summary
- Definitions
|
 |
Traffic to the
site increased at 4.48%
monthly, which is about
69%
annual growth rate. |
 |
Average 134,000
hits per day |
 |
Average 21,000
page views per day or
640,000
page views a month |
 |
63%
of visits are from the United States,
3%
from Canada, and
31%
are from outside of North America (including China, Singapore, Hong
Kong, Australia, and Europe). |
|
|
|
|
| 1. |
Site Summary of ChinaSite.com |
 |
|
| Offisite links: |
3400 |
Avg links/page: |
85 |
| Onsite pages: |
152 |
Onsite images: |
334 |
|
| 2. |
General Activity Statistics
|
 |
|
| Analysis
date: 7/29/99 |
Duration analyzed: 7/17/99 -
7/28/99 |
|
|
|
Average Number of Hits Per Day |
133,754.34 |
| Average
Number of Page Views (Requests ) Per Day |
20,999.25 |
|
Average Number of Visits Per Day |
2766.95
|
| Average
Number of Page Views Per Visit |
7.59 |
|
Average Visit Duration |
00:05:06 |
|
|
|
| 3. |
User
Organization and
Geography |
 |
|
3.1 Organizations
Breakdown
| Number of
U.S. Organizations |
63% |
|
Number of Canadian Organizations |
3% |
| Number of
International Organizations |
31% |
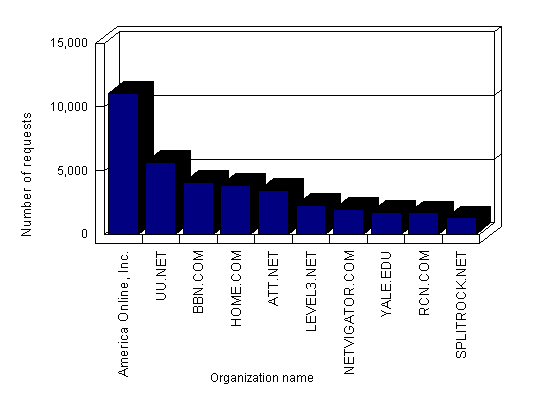
3.2 Top 10 U.S. Organizations
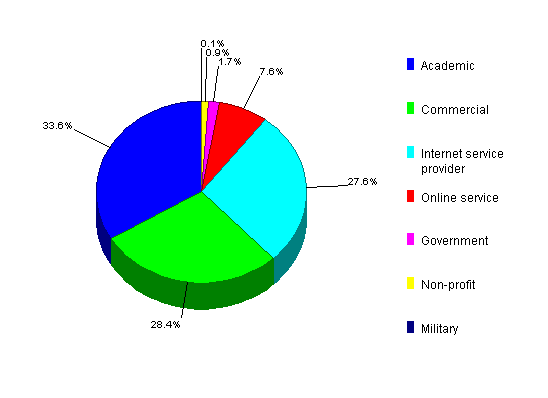
3.3 U.S. Page Views by Organization Type
3.4 Top 15 U.S. Organizations by Organization type
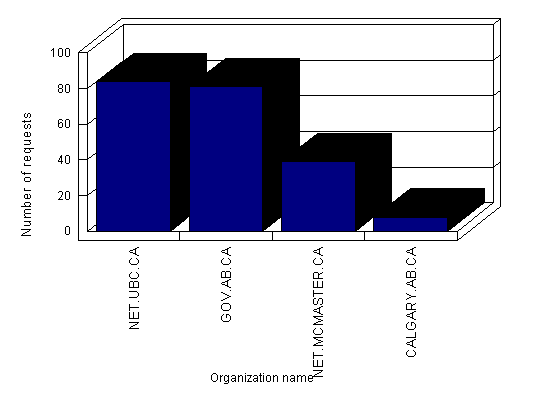
3.5 Top 10 Canadian Organizations
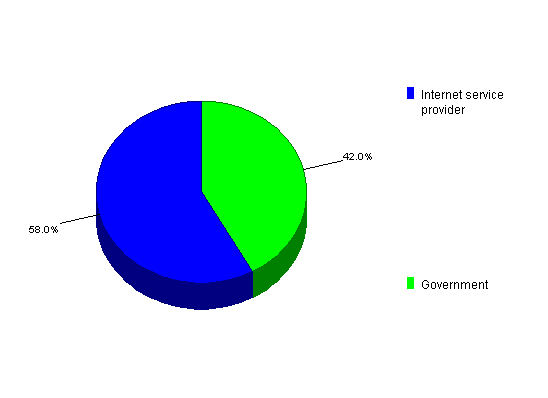
3.6 Top 15 Canadian Organizations by
Organization Type
|
Organization Type
Organization Name |
% of Canadian
Page Views |
| 1. |
Internet service
provider |
|
|
NET.UBC.CA |
39.62% |
|
NET.MCMASTER.CA |
18.40% |
|
Subtotal (Internet
service provider) |
58.02% |
| 2. |
Government |
|
|
GOV.AB.CA |
38.21% |
|
CALGARY.AB.CA |
3.77% |
|
Subtotal
(Government) |
41.98% |
|
Total (Organization
types) |
100.00% |
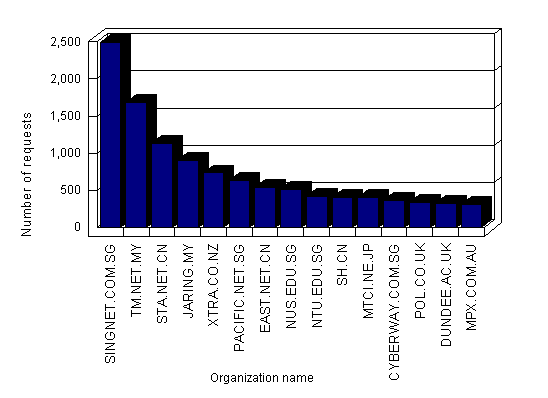
3.7 Top 15 International Organizations
3.8 Top 15 Organizations for The top 10
International Countries
|
|
|
| 4. |
Request Summary |
 |
|
4.1 Top 10% of All Page View
(Requests)
The 10% of files that received the most requests.
|
| 5. |
Visit Summary |
 |
|
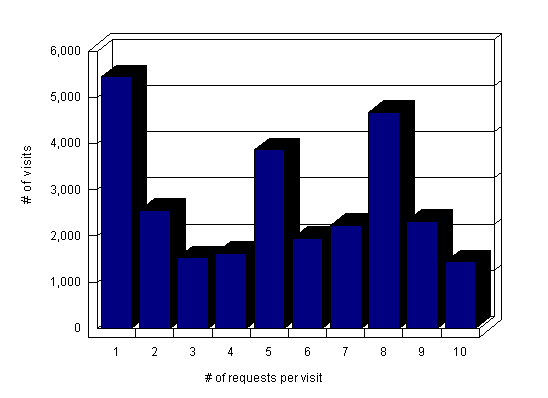
5.1 Request Patterns Per Visit
The
distribution of the top 10 values for "number of requests per visit" over the
analysis period shows that users were engaged on our site very well.
5.2 Top 10% of First Requests
The top first pages that users see when coming to your
site. The data reflects links from other sites or URLs entered by a user.
5.3 Top 10% of last Requests
The most frequently viewed files prior to a user exiting
your site.
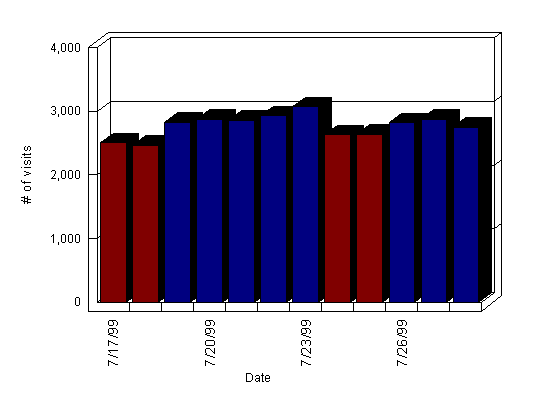
5.4 Daily visit trends
Shows the number of visits for each day in the analysis
period. Weekdays are shown as blue bars and weekends as red ones.
5.5 Daily Visit Statistics
|
Average
number of visits (all days) |
2,766.95 |
|
%
of visits (weekdays) |
69.20% |
|
%
of visits (weekends) |
30.80% |
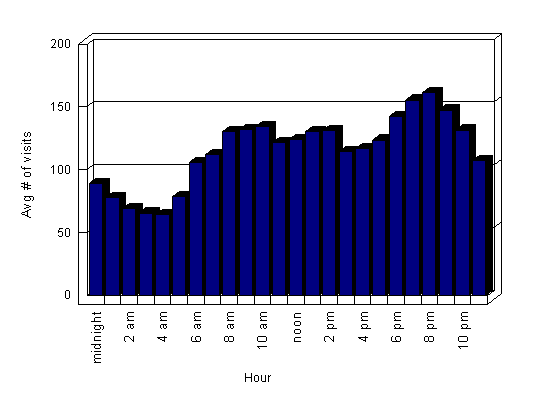
5.6 Visits by Hour of the Day
5.7 Hourly Visit Statistics
|
Average number of visits (all hours) |
115.29 |
|
% of visits (work hours) |
40.80% |
|
% of visits (nonwork hours) |
59.20% |
5.8 Visits and Requests by Hour of the Day
Shows for each hour of the day the average number of
requests and visits plus the average number of requests per visit.
| Hour |
Avg # of Requests |
Avg # of Visits |
Avg Requests Per Visit |
| midnight |
184.67 |
88.67 |
2.08 |
| 1 am |
169.09 |
78.17 |
2.16 |
| 2 am |
140.59 |
69.00 |
2.04 |
| 3 am |
143.51 |
65.50 |
2.19 |
| 4 am |
129.17 |
64.59 |
2.00 |
| 5 am |
156.42 |
78.42 |
1.99 |
| 6 am |
198.43 |
105.42 |
1.88 |
| 7 am |
231.01 |
112.09 |
2.06 |
| 8 am |
262.01 |
130.42 |
2.01 |
| 9 am |
270.51 |
132.17 |
2.05 |
| 10 am |
279.18 |
134.67 |
2.07 |
| 11 am |
248.59 |
122.01 |
2.04 |
| noon |
263.18 |
124.17 |
2.12 |
| 1 pm |
275.60 |
130.26 |
2.12 |
| 2 pm |
275.93 |
131.26 |
2.10 |
| 3 pm |
251.43 |
114.25 |
2.20 |
| 4 pm |
253.68 |
116.67 |
2.17 |
| 5 pm |
249.51 |
123.59 |
2.02 |
| 6 pm |
279.35 |
142.17 |
1.96 |
| 7 pm |
337.93 |
155.51 |
2.17 |
| 8 pm |
340.43 |
161.26 |
2.11 |
| 9 pm |
319.18 |
147.67 |
2.16 |
| 10 pm |
277.26 |
131.67 |
2.11 |
| 11 pm |
220.01 |
107.34 |
2.05 |
| Total |
5,756.66 |
2,766.95 |
|
|
|
|
| 6. |
Daily Hits Trend and Statistics |
 |
|
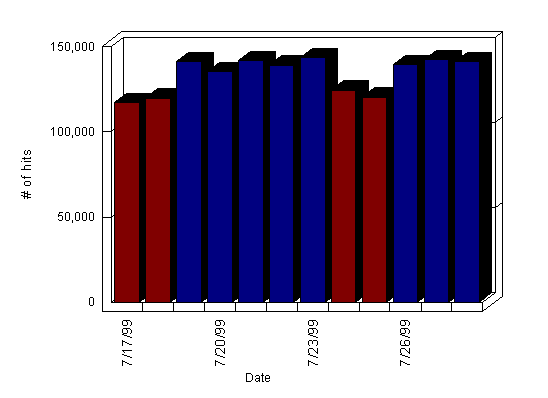
Shows the hits for each day in the analysis period. Weekdays are
shown as blue bars and weekends as red bars.
|
Average
number of hits (all days) |
133,754.34 |
|
%
of hits (weekdays) |
69.99% |
|
%
of hits (weekends) |
30.01% |
| Date |
Bandwidth
(MB)
|
#
of hits |
| 7/17/99 |
454.61 |
116,971 |
| 7/18/99
|
461.60
|
119,805
|
| 7/19/99 |
522.40 |
141,124 |
| 7/20/99
|
504.71
|
135,201
|
| 7/21/99 |
500.94 |
141,673 |
| 7/22/99
|
497.50
|
139,087
|
| 7/23/99 |
509.02 |
143,503 |
| 7/24/99
|
455.89
|
124,556
|
| 7/25/99 |
435.25 |
120,267 |
| 7/26/99
|
487.62
|
139,280
|
| 7/27/99 |
502.09 |
142,372 |
| 7/28/99
|
511.79
|
141,145
|
| Average |
493.60 |
128,023 |
| Total |
2,961.62 |
768,135 |
|
| 7. |
Bandwidth Summary |
 |
|
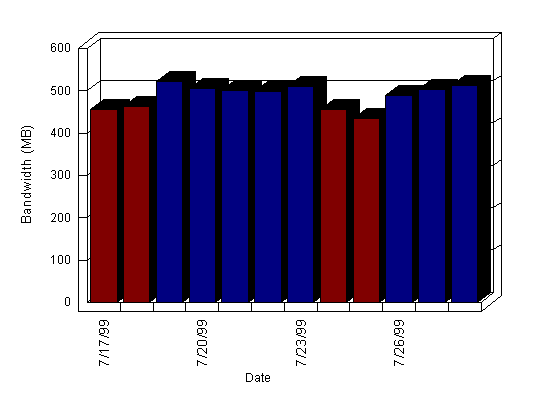
7.1 Daily Bandwidth Trends
Shows the bytes transferred for each day in the
analysis period. Weekdays are shown as blue bars and weekends as red bars
.
7.2 Daily Bandwidth Statistics
|
Average
bandwidth (MB) (all days) |
486.97 |
|
%
of bandwidth (weekdays) |
69.07% |
|
%
of bandwidth (weekends) |
30.93% |
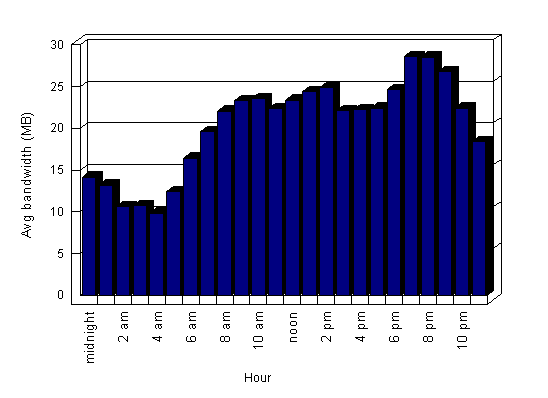
7.3 Hourly Bandwidth Statistics
|
Average
bandwidth (MB) (all hours) |
20.29 |
|
%
of bandwidth (work hours) |
42.84% |
|
%
of bandwidth (nonwork hours) |
57.16% |
Shows the average bandwidth (MB) for each hour of the day
and the percentage of total bytes transferred per day during each hour.
|
| 8. |
Definitions |
 |
|
| Hit |
Any connection to an Internet site, including inline images
and errors. |
|
Request
(Page View) |
Any hit that successfully retrieves content. Unlike hits,
requests are related to content and user behavior. For example, if a user requests an HTML
page that has three graphics files, the web server might make a log entry for the three
graphics files, the HTML page, and perhaps add some lines for overhead. However, only one
request is counted by Analysis. |
|
| Visit |
A series of consecutive requests from a user to an Internet
site. If your log file data includes referrer data, then new visits begin with referring
links external to your Internet site. Regardless of whether or not you have referrer data,
if a user does not make a request after a specified time period, the previous series of
requests is considered to be a completed visit. |
|
| User |
Anyone who visits your site at least once. If your log file
data contains cookie data, users will be identified by their cookie . If your log files do
not contain cookie data, a registered username is assigned to users. Or, if no
registration information is available, users’ are identified by their Internet
hostnames. Many organizations use Internet gateways, which mask the real Internet
hostnames, so user counts may be conservative for those users identified by their Internet
hostnames. |
|
| Organization |
A commercial, academic, nonprofit, government, or military
entity that connects users to the Internet, identified by an entity’s Internet
domains. Microsoft Site Server Analysis groups together all domains registered to the same
organization as one organization. If a domain is unavailable in the database, one Internet
domain is used to identify one organization. |
|
| Request duration |
The time between two consecutive requests in the same visit. |
|
| Visit duration |
The time between the first and last request of a visit. This
time does not include how long users viewed the last request of a visit. |
|
| Ad request |
An opportunity to deliver an advertising element to a Web
site visitor. An ad request is a measure of the "active technology" that
requires the user to interact with the site before a new advertisement will appear. |
|
| Ad click |
The opportunity for a Web site visitor to be transferred to a
location by clicking on an advertisement, as recorded by the server. |
|
| Ad click rate |
The percentage of ad requests that resulted in an ad click. |
|
| Geography |
The continent, country, region, state, city, and zip code are
based on an organization's Internet domain registration. Only Internet domains found in
the Analysis database are included in region, state, city, and zip code analyses. Each
Internet domain is associated with only one zip code, so all users from a domain used in
multiple locations are considered to be at one location. |
|
|

